Build your own strategy, backtest it, improve it
Most strategy ideas die between having them and testing them, because testing one means writing Pine Script. This is the same loop without that step: describe the setup, watch it mark your chart, test it, change one rule, test it again — in about two minutes.
What the example actually produced
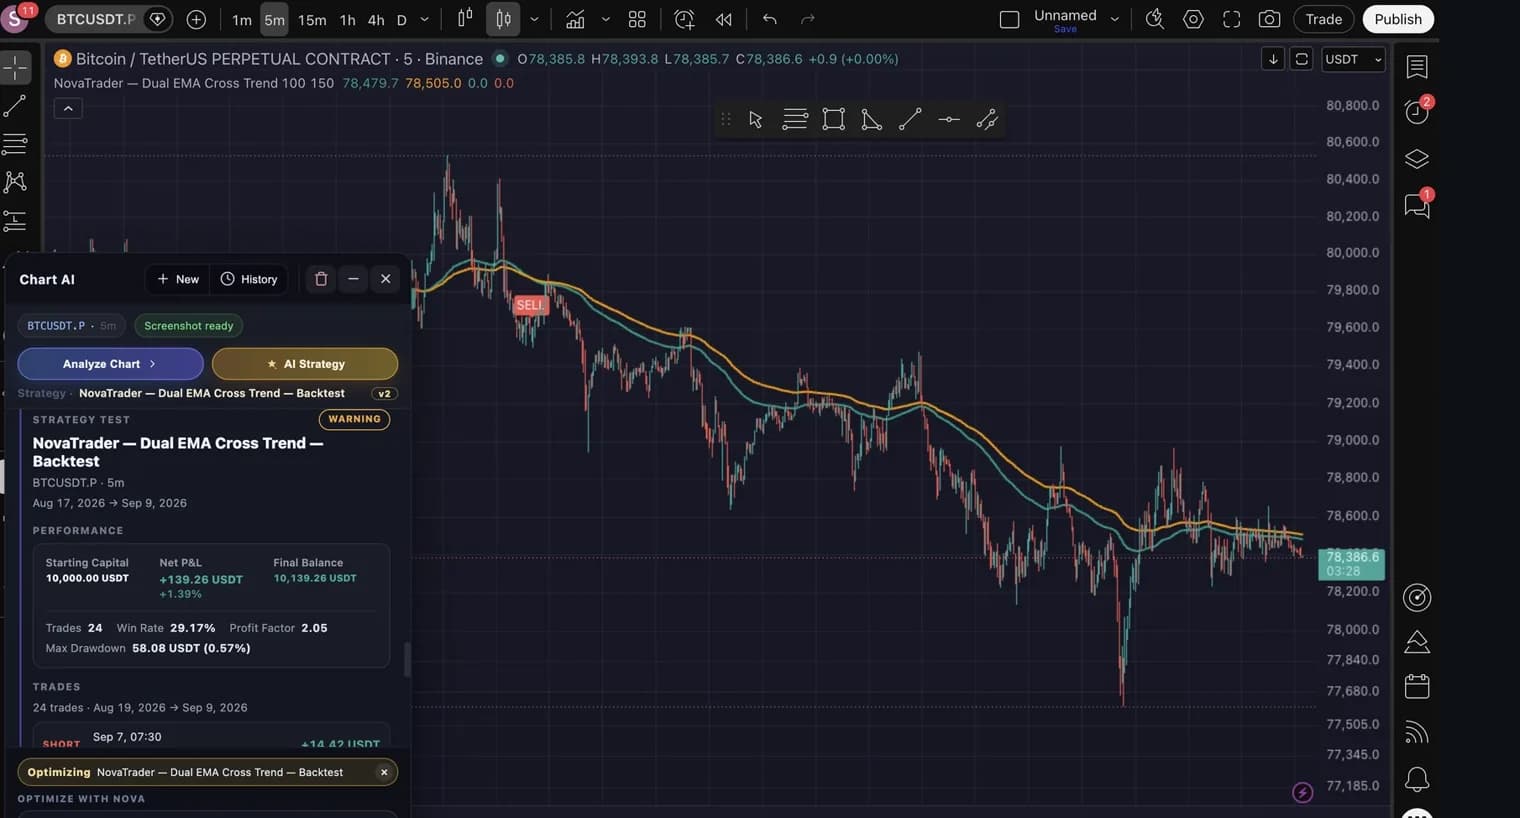
One sentence in, two backtests out. The first version lost money — which is the more useful half of the demonstration, because it is what finding out cheaply looks like.
| Metric | EMA 20/50 | EMA 100/150 |
|---|---|---|
| Net P&L (USDT) | −62.07 | +139.26 |
| Trades | 134 | 24 |
| Profit factor | 0.85 | 2.05 |
| Max drawdown (USDT) | 206.58 (2.04%) | 58.08 (0.57%) |
Read that carefully. The slower crossover made money where the faster one lost it, and it did so by trading far less — 134 trades down to 24. But 24 trades is a small sample, and a strong profit factor over a small sample is the shape overfitting takes. The honest conclusion is “worth a longer test”, not “solved”.
Why the backtest matches the chart
There is an obvious way to build this and it is wrong: ask the model for an indicator, then ask it again for a strategy version. Those two answers drift — not usually, and not visibly, which is worse. A backtest quietly testing an EMA(21) while your chart plots an EMA(20) produces a number you would believe.
So it is built the other way round. The model writes one thing — the signal definition, the calculations and the buy and sell conditions — and that block is wrapped twice: once as the indicator() that draws on your chart, once as the strategy() the Strategy Tester runs. The conditions are the same characters in both scripts. There is no second interpretation available to disagree with the first.
The loop, step by step
- 01
Install the NovaTrader extension for Chrome
Everything below happens inside TradingView. The extension is free, distributed only through the Chrome Web Store, and adds a panel to the chart you already use — no separate app, nothing to import, and no change to your TradingView account. Open it and pick “Build your own strategy”.
Get it on the Chrome Web Store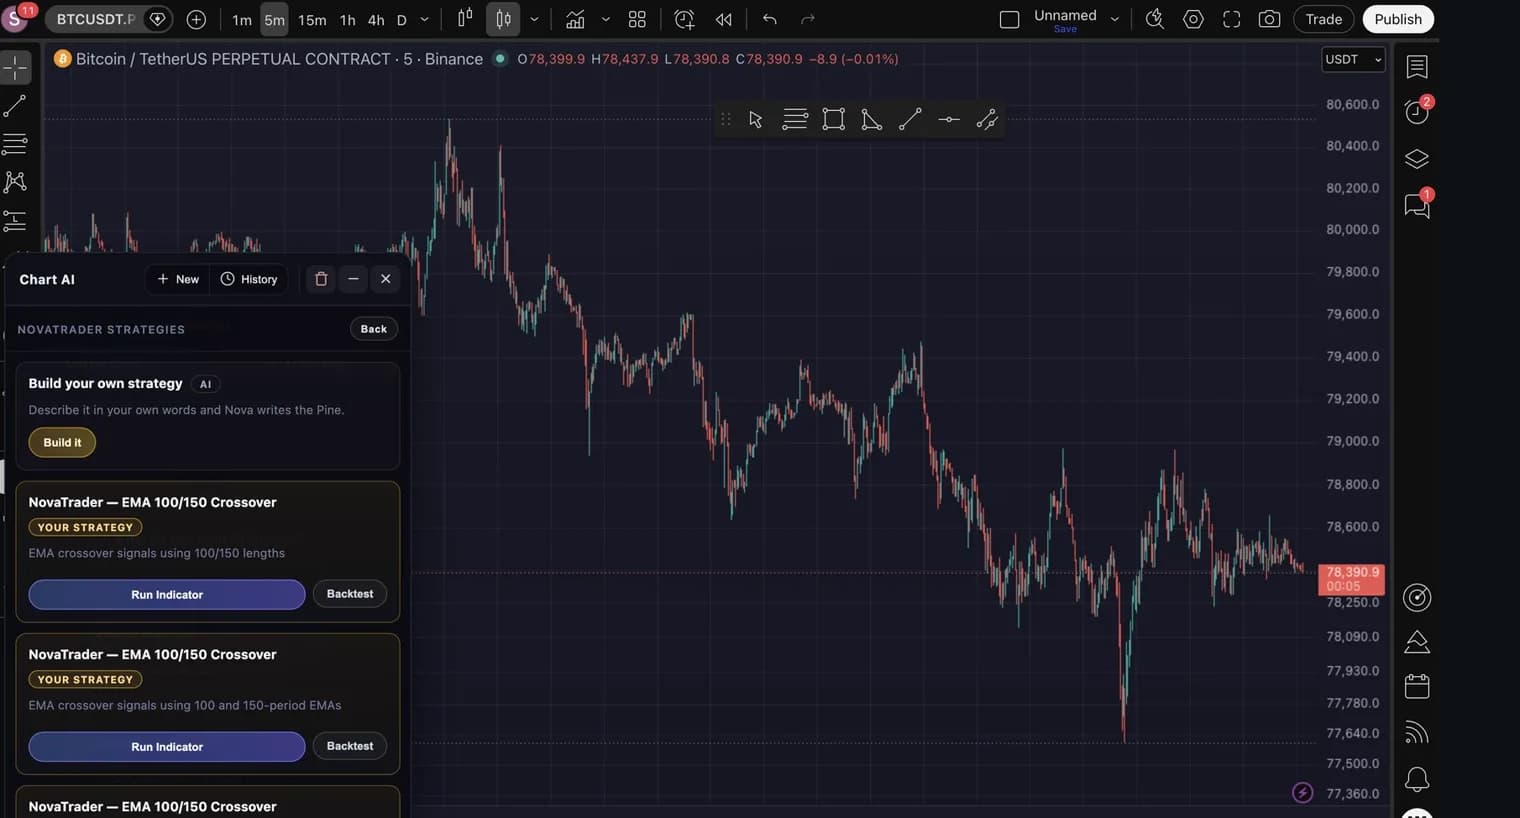
- 02
Describe the setup in your own words
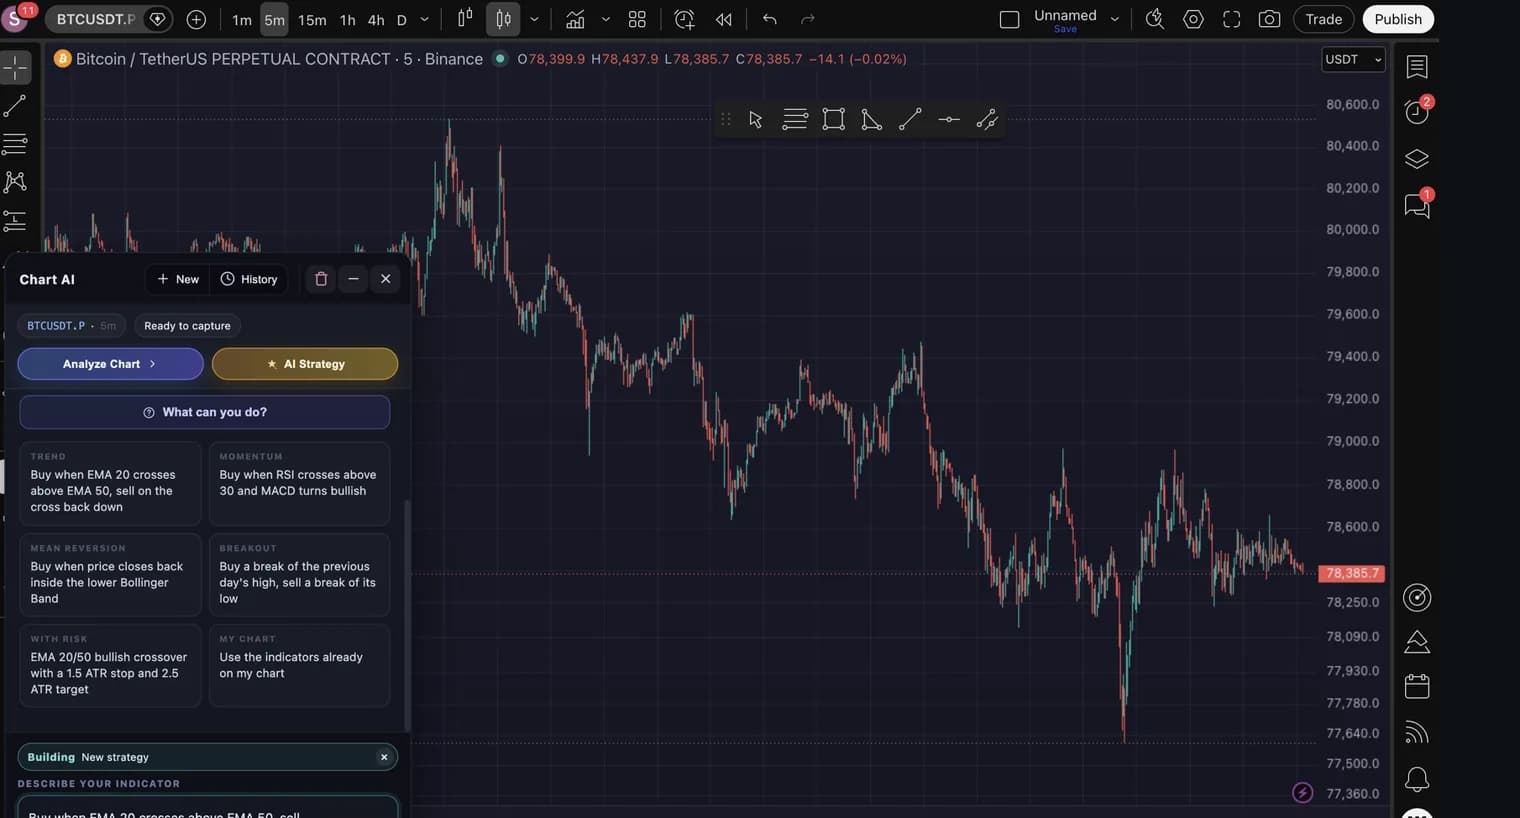
Write what you want in plain English — “Buy when EMA 20 crosses above EMA 50, sell on the cross back down”. No Pine Script, no parameters to fill in. If you refer to an indicator already on your chart, its settings are used rather than invented ones.
- 03
Nova writes the indicator and checks it compiles
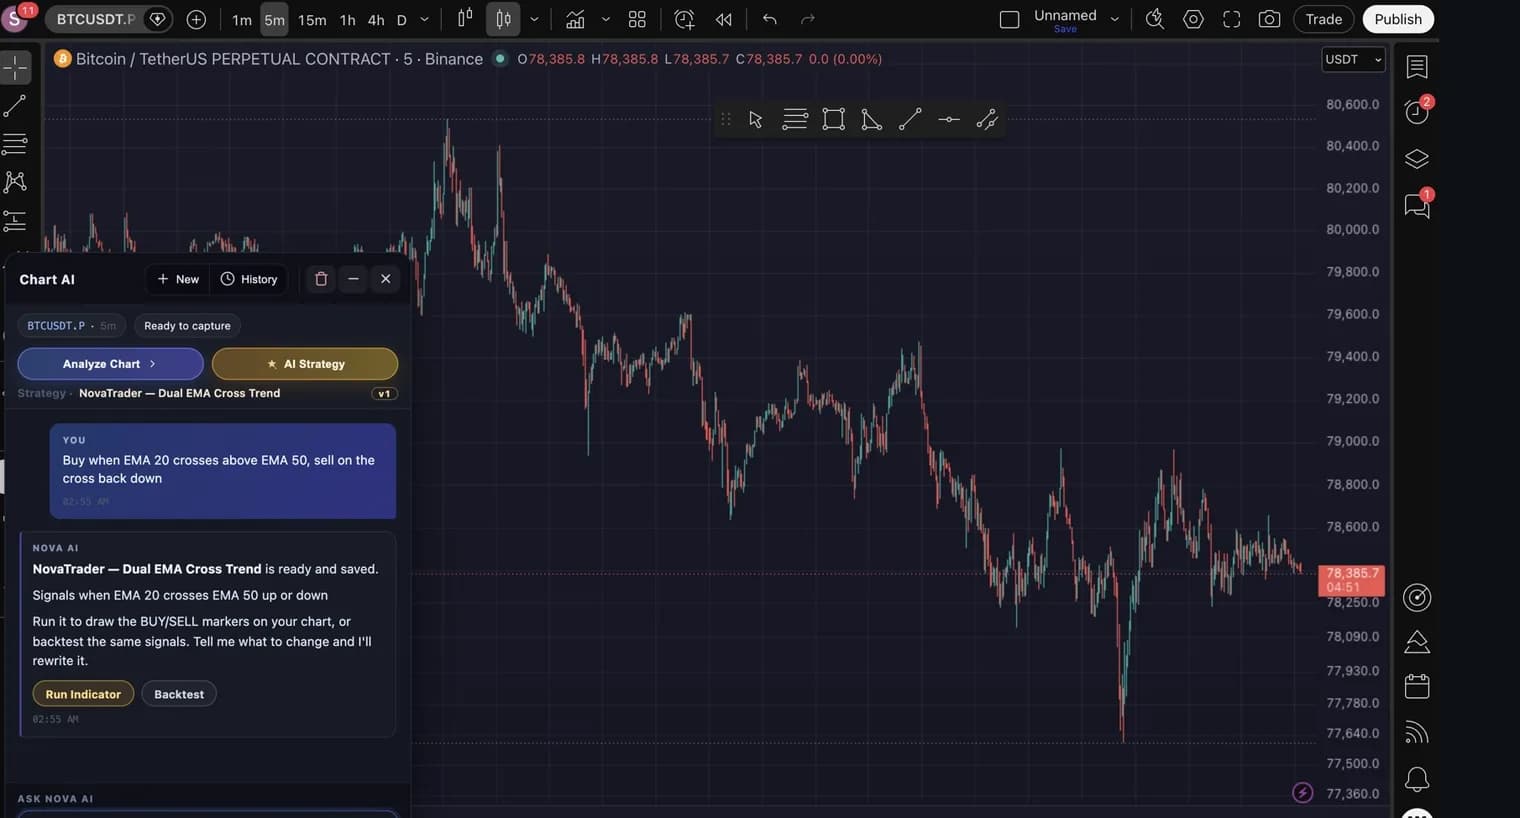
A Pine Script v6 indicator is generated, validated, and saved to your list. A script that would not compile is rejected rather than stored, so the list never fills with broken strategies. You get two actions: Run Indicator, and Backtest.
- 04
Run it — BUY and SELL markers on the candles
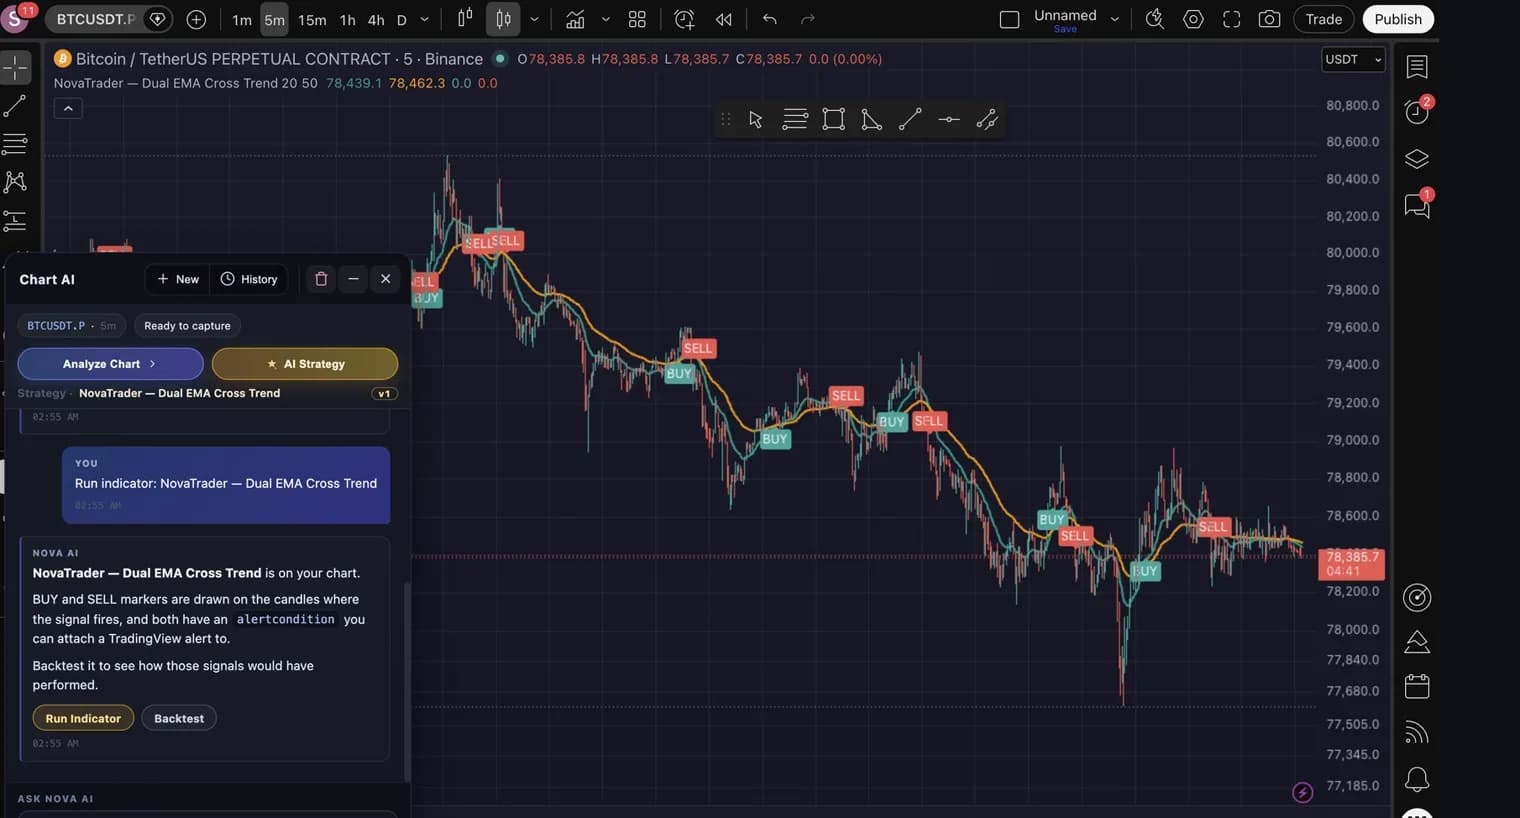
Run Indicator adds it to the chart. Signals are drawn on the bars where they actually fire, one label per signal rather than one on every bar the condition stays true, and each signal carries an alertcondition you can attach a TradingView alert to.
- 05
Backtest the exact same signals
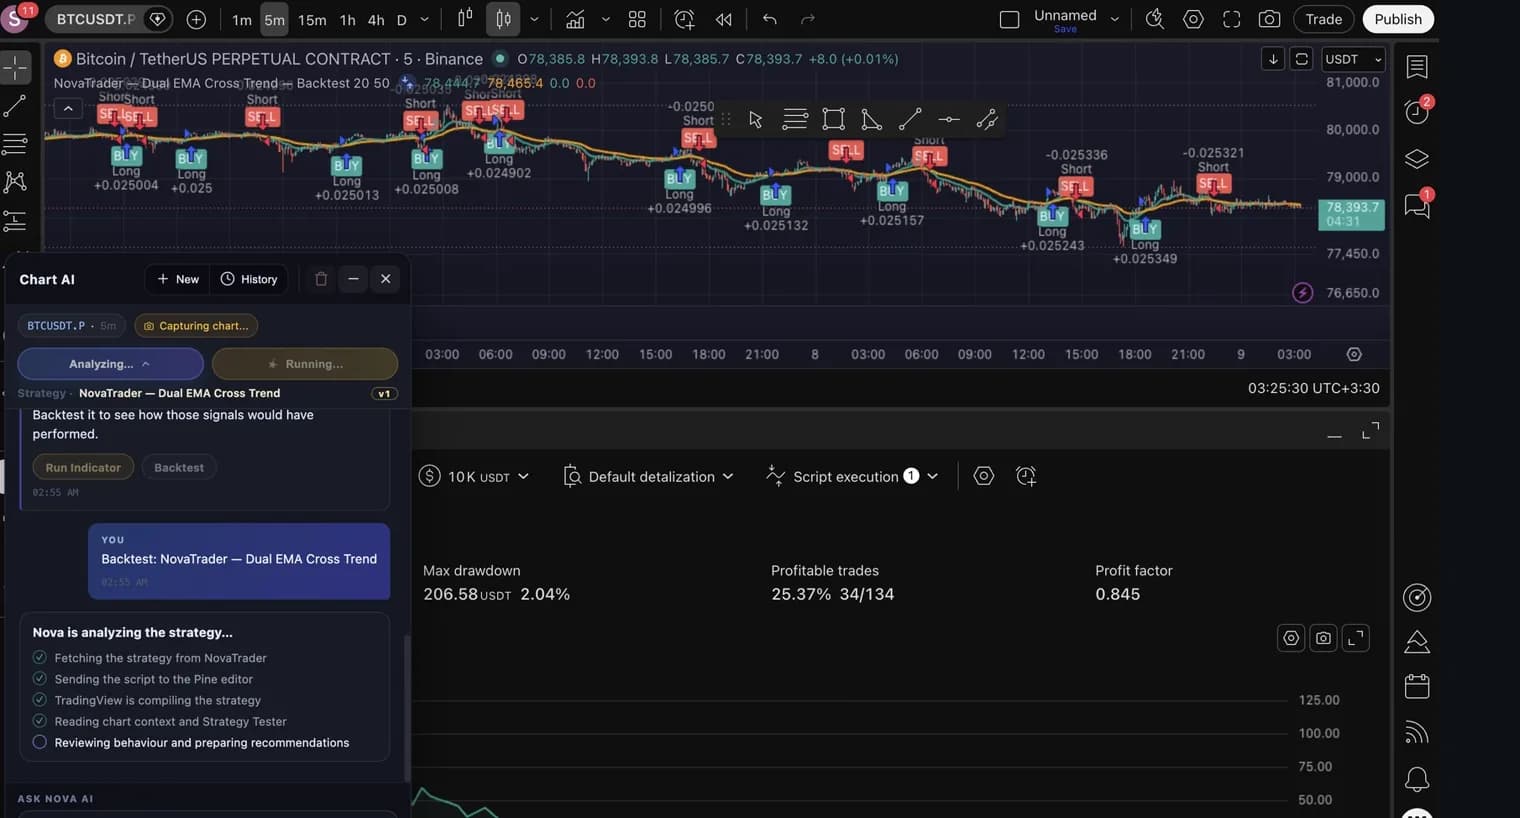
Backtest swaps the indicator for its strategy form and runs it through TradingView's own Strategy Tester — the panel at the bottom of the screenshot is TradingView's, not ours. It is not a second interpretation of your description: one shared definition produces both the indicator you were looking at and the strategy being tested.
- 06
Read the result — including when it is bad
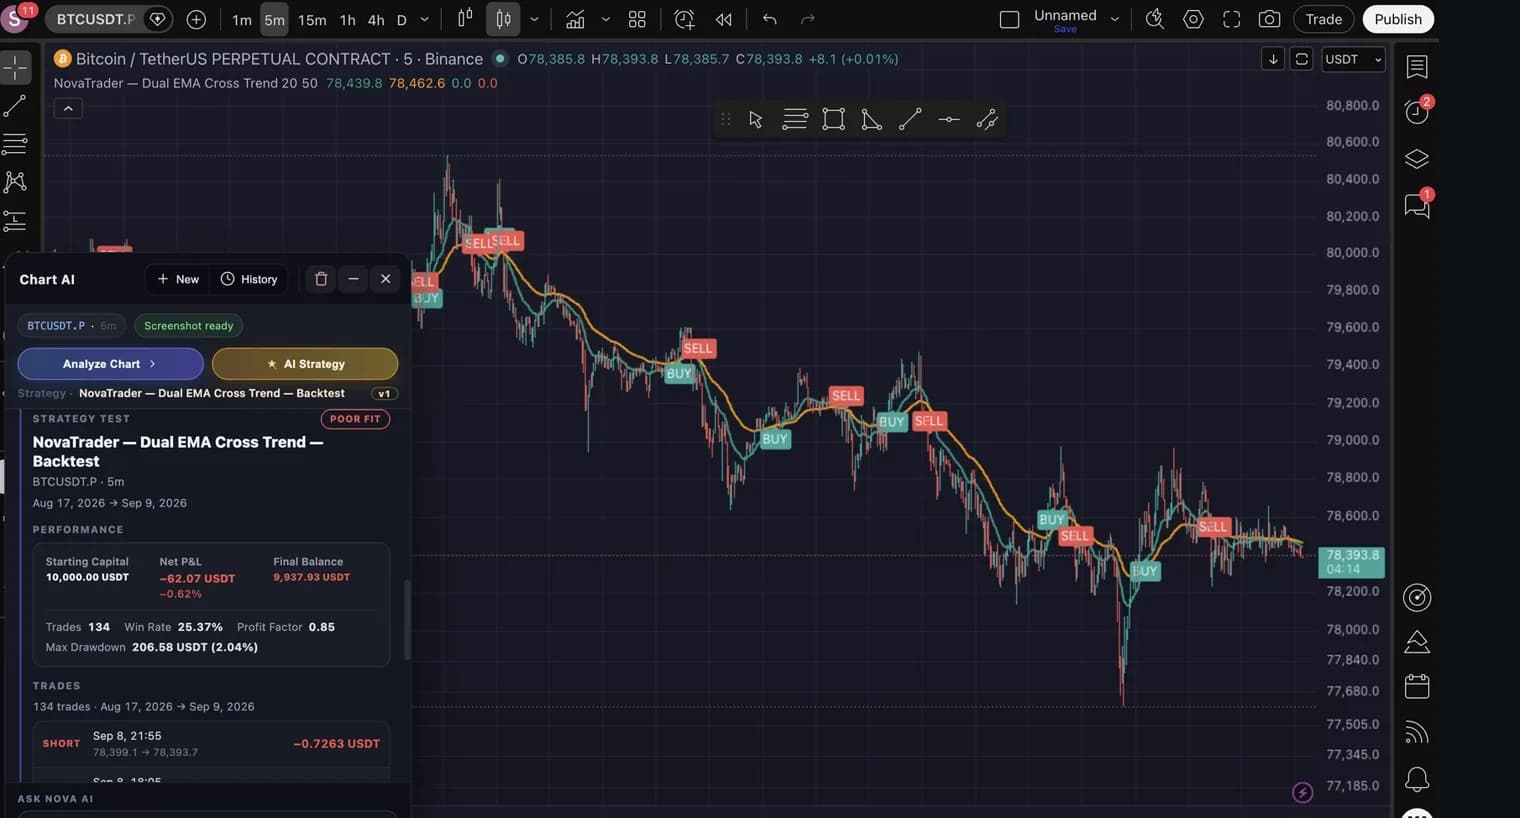
The first version lost money: −62.07 USDT across 134 trades with a profit factor of 0.85. That is a useful answer. A fast crossover on a 5m chart fires constantly and pays the spread every time, and the trade count is what tells you so.
- 07
Scroll for the trades and the written read-out
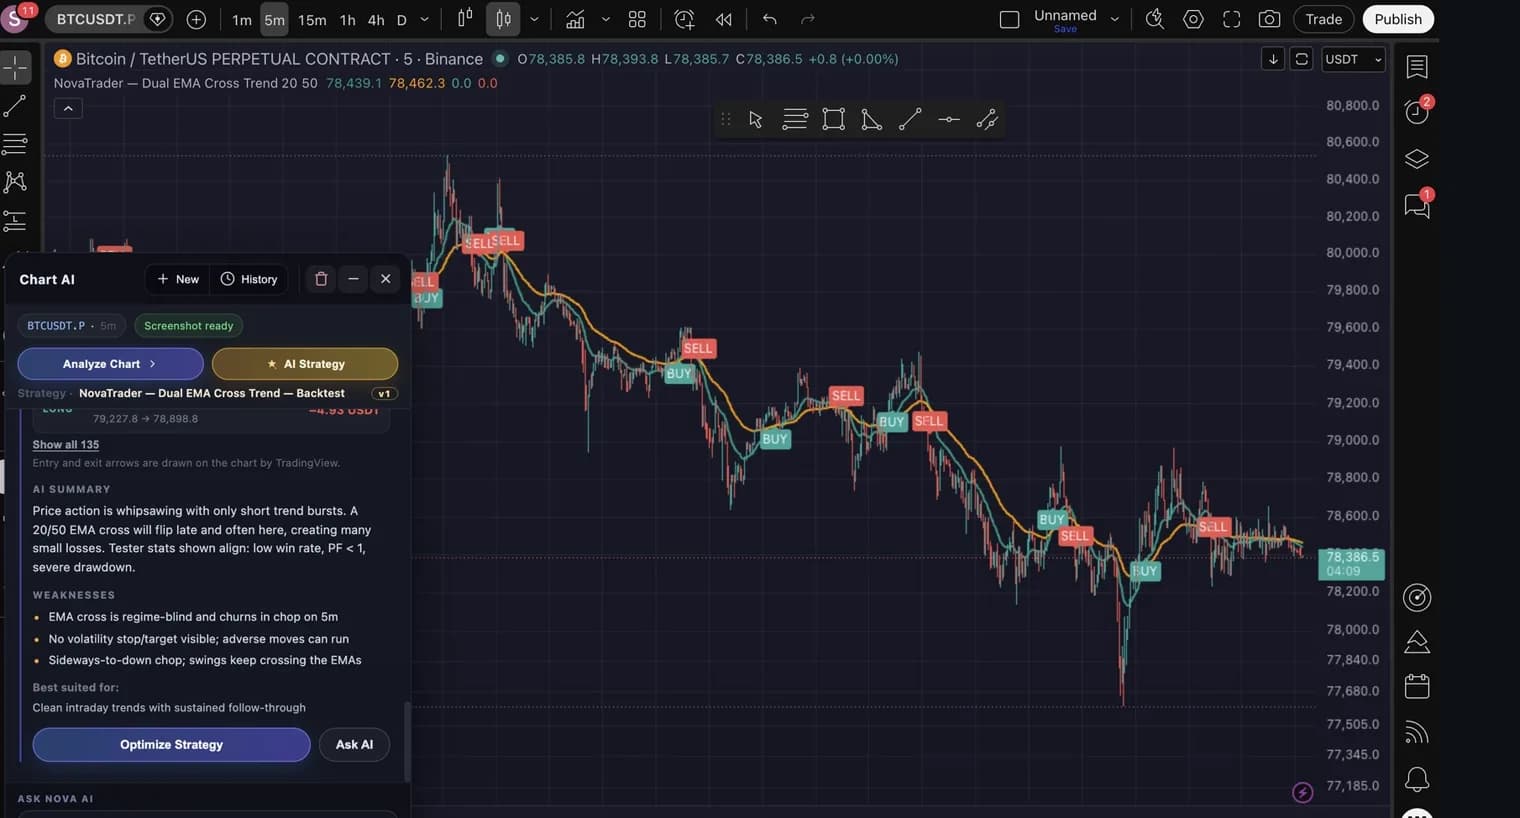
Under the numbers are the individual trades and a short summary of what went wrong — here, that a bare crossover is regime-blind and churns in chop on a 5m chart. The numbers come from the Strategy Tester; only the prose is written by the AI.
- 08
Change one rule and test again
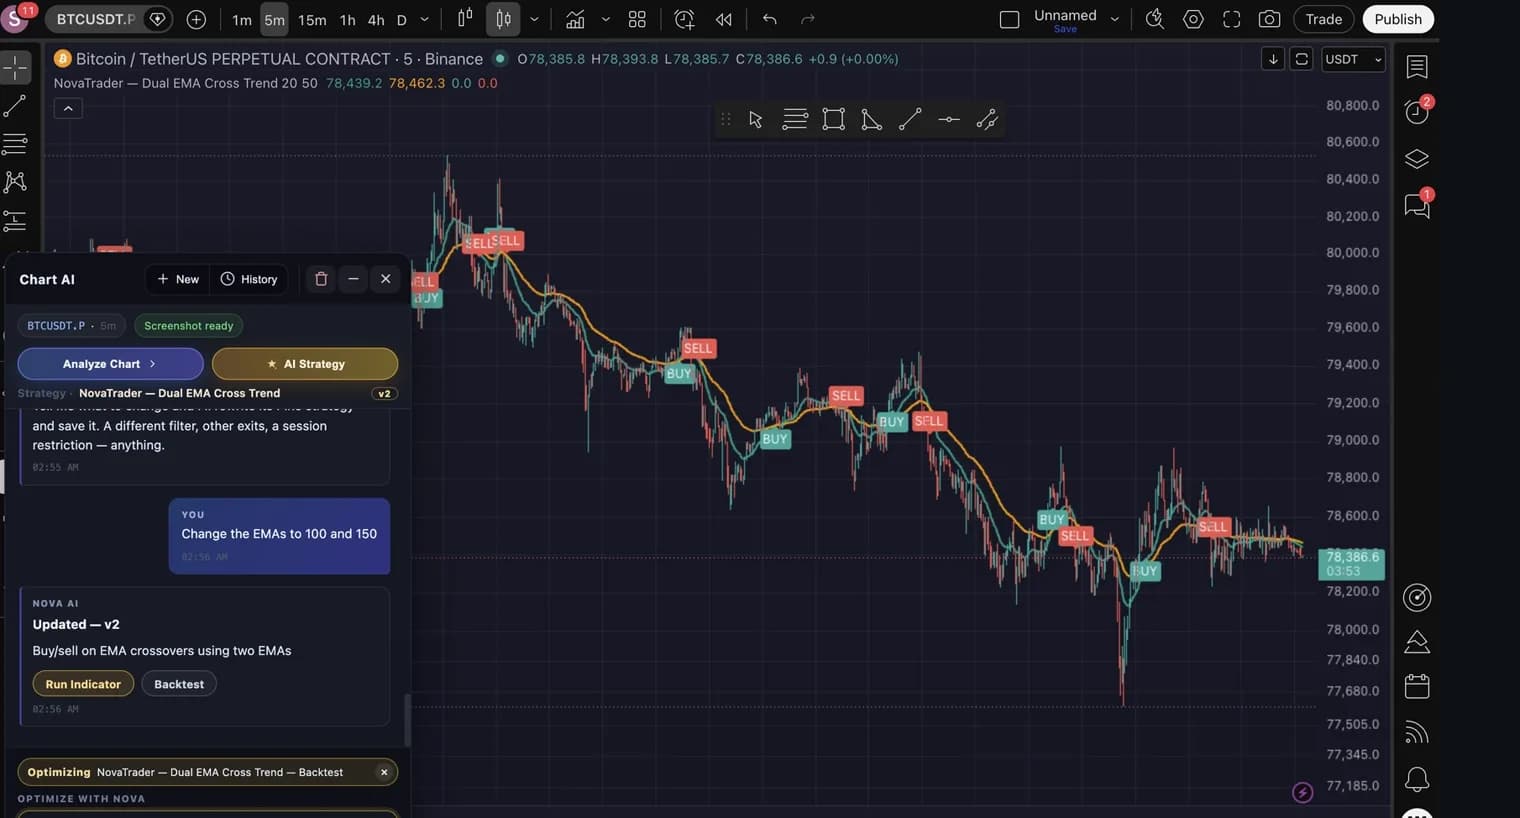
Say what to change — “Change the EMAs to 100 and 150”. The indicator is rewritten in place as v2 rather than started over, and the same Backtest button re-runs it. Comparing two runs that differ by one rule is the only way to know whether the rule was the problem.
- 09
Compare, and keep what survives
Slowing the crossover down cut the sample from 134 trades to 24 and turned −62.07 into +139.26 USDT, with the drawdown falling from 206.58 (2.04%) to 58.08 (0.57%). Fewer, better trades — with the caveat that 24 trades is a small sample.
What you can ask for
Anything you can state as a condition. These are all single sentences that produce a working indicator:
- “Buy when RSI crosses above 30 and MACD turns bullish. Sell when RSI crosses below 70.”
- “Buy when price closes back inside the lower Bollinger Band.”
- “Buy a break of the previous day’s high, sell a break of its low.”
- “EMA 20/50 bullish crossover with a 1.5 ATR stop and a 2.5 ATR target.”
- “Buy when price is above the 200 EMA and RSI is above 55.”
RSI, MACD, EMA and SMA, VWAP, Bollinger Bands, Ichimoku, ATR, Supertrend, volume and price action are all available, alone or combined. Say the numbers you want and those are the numbers used.
Four ways this goes wrong
- Tuning until it works. Changing lengths until the backtest turns green is memorising the past, not learning from it. If a small change collapses the result, the result was noise.
- Trusting a small sample. The improved version on this page has 24 trades. That is an encouraging number, not a conclusive one. Under about 30, outliers decide everything.
- Testing one regime. A trend-following crossover tested only through a trend will look excellent. Run it through a range — that is where it costs you.
- Forgetting costs. Every trade pays a spread. It is why the 134-trade version lost money while the 24-trade version did not, and it is the first thing to check when a high-frequency idea underperforms.
Try it on your own chart
NovaTrader runs inside TradingView. Describe a setup, watch it mark your chart, and test it before you trade it.
Frequently asked questions
- Can I build a trading strategy without knowing Pine Script?
- Yes — that is the point of this. You describe the entries and exits in plain English and a Pine Script v6 indicator is written for you, checked that it compiles, and saved. You can read the generated code in TradingView's Pine editor at any time, and edit it there if you want to; nothing is hidden or obfuscated.
- Is the backtest testing the same thing the chart is showing?
- Yes, and it is worth understanding why that is not automatic. If a tool asks the model once for an indicator and again for a strategy, those two answers drift — quietly, and in ways you would believe. NovaTrader generates one shared signal definition and wraps it twice: once as the indicator that draws on your chart, once as the strategy the Strategy Tester runs. The signal conditions are the same characters in both.
- Why did the indicator only show one label per signal?
- Because a condition like “RSI above 55” stays true for many bars in a row, and drawing a label on every one of them makes the chart unreadable. Signals are gated on the bar the condition becomes true, so a twenty-bar run produces one label rather than twenty. For a crossover — which is already a single-bar event — this changes nothing.
- Does backtesting remove my indicator from the chart?
- It swaps it out and puts it back. Only one NovaTrader script sits on a chart at a time, so the backtest version replaces the indicator while it runs and the indicator is restored afterwards — including when the backtest fails. Studies you added yourself are never touched.
- The improved version had fewer trades. Is that better?
- It is better on these figures and it is still a small sample. Twenty-four trades is not enough to be confident, which is why the trade count sits next to the other metrics rather than below them. The honest reading of the example on this page is “the slower version looks materially better and deserves a longer test”, not “the strategy is fixed”.
- Can I add a stop loss or take profit?
- Ask for one and it is preserved through to the backtest — “1.5 ATR stop and 2.5 ATR target”, for instance. If you do not ask, none is invented: a backtest carrying risk rules you never described is answering a question you did not pose.
Already have a strategy and want to read its numbers properly? See how to backtest trading strategies using AI.
The figures on this page are from the recorded session shown above and describe past performance on one symbol and timeframe. Backtest results do not predict future returns. Nothing here is financial advice.