Pro trader level analysis, from one screenshot
Paste a chart image in and get back what a desk analyst would tell you: the structure, the levels that matter, a direction with a number attached to it, and — when there is no trade — the two plans either side of the range. One upload, about nine seconds, no account for the first one.
What one screenshot produced
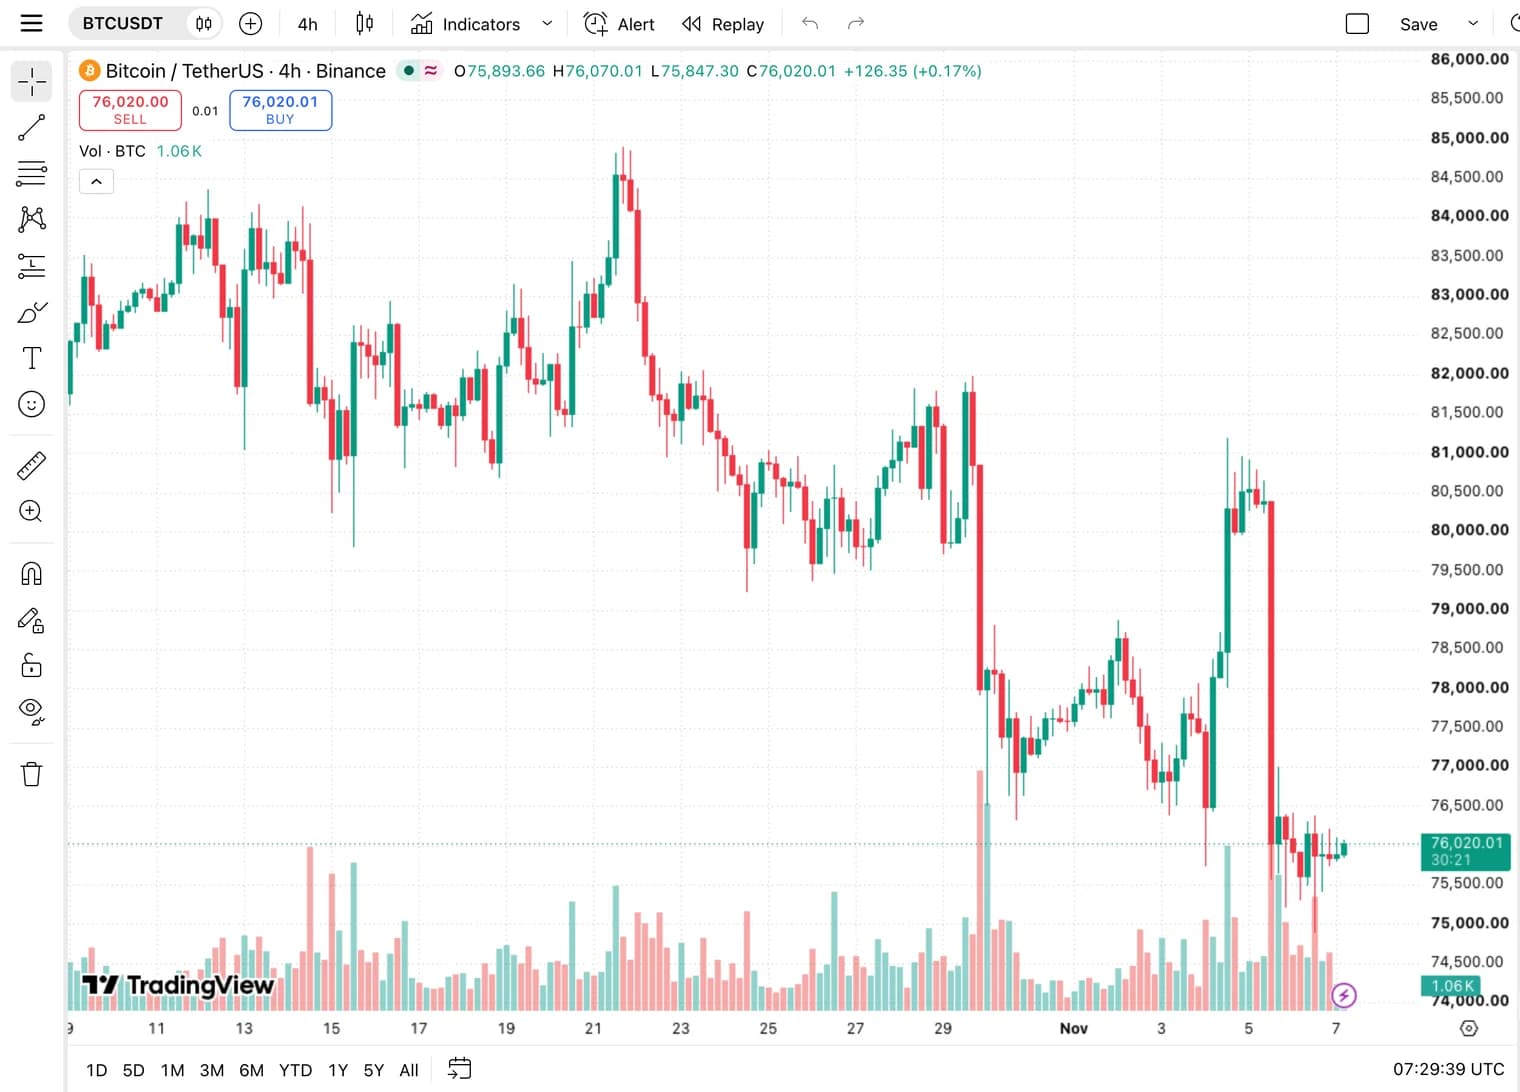
A BTCUSDT 4h chart, captured on 7 November 2026, 07:29 UTC with price at 76,020, uploaded as a single 2505 × 1800 image. The symbol and the timeframe were never typed in — they were read off the picture, with full confidence in both.
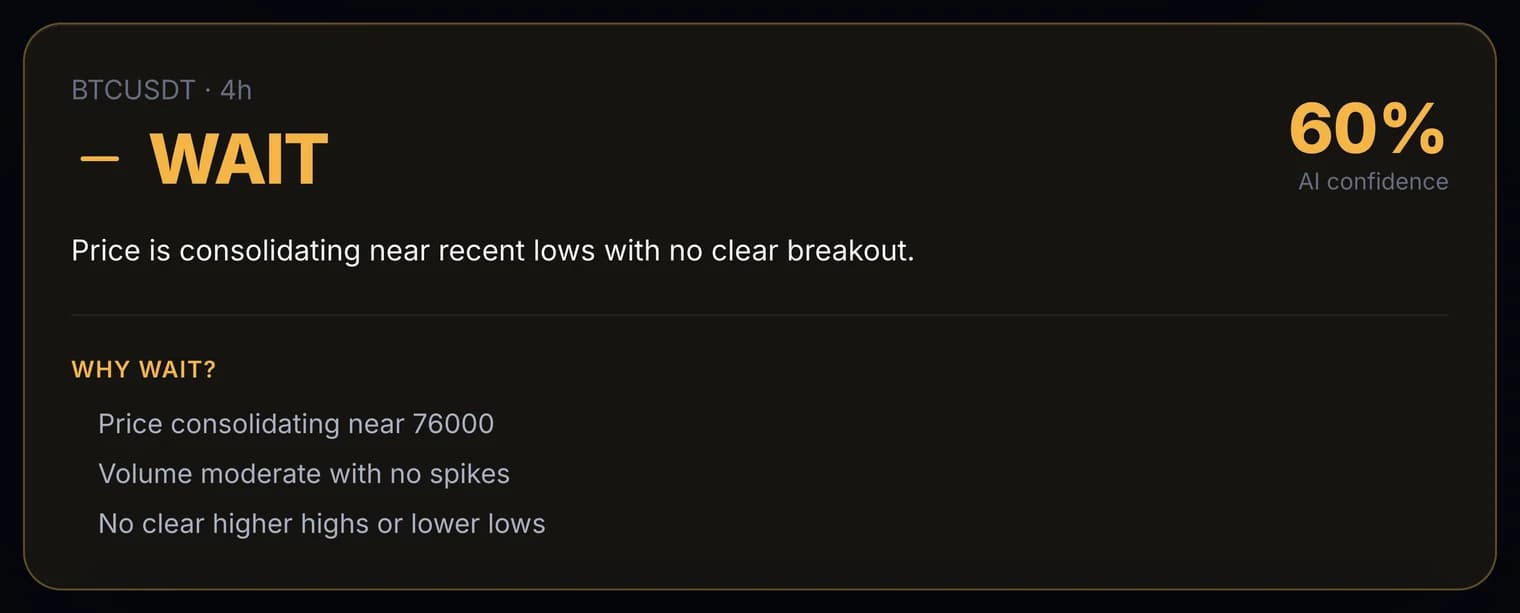
Price is consolidating near recent lows with no clear breakout.
The most useful thing it said was no
There is no entry on that card, and that is not a gap in the output — it is the output. The field that would carry a trade idea came back unavailable, because price was consolidating under resistance with no break in either direction. An entry here would have been invented rather than read, and a tool that always has a trade for you is a tool that is sometimes making one up.
What it returned instead is the thing an analyst would actually say — not “buy” or “sell”, but here is what has to happen first, and here is the trade on each side of it:
4H candle close above 78,000
- Entry
- 78,000 – 78,300
- Stop loss
- 75,000
- Targets
- 81,000 then 84,000
- Risk / reward
- 1 : 2.5
4H candle close below 75,000
- Entry
- 74,900 – 74,600
- Stop loss
- 78,000
- Targets
- 72,000 then 70,000
- Risk / reward
- 1 : 2.3
Both plans came back in the same response as the WAIT. The free card on this site shows you the call and the reasons; the conditional plans, the invalidation level and the warnings below are rendered in the NovaTrader app, where analyses are also saved to your history.
The levels it read off the picture
Four of them, each with a strength. They are not decoration, and the way to check that is to look at what the rest of the answer is built from: both conditional plans above take their stop from this list, and the invalidation line below is written entirely in terms of the two strong ones.
| Level | Price | Strength |
|---|---|---|
| Resistance | 78,000 | strong |
| Resistance | 81,000 | moderate |
| Support | 75,000 | strong |
| Support | 74,000 | moderate |
A 4H candle close above 78000 or below 75000 will clarify the next trend direction.
And what it told you it could not see
Unprompted, in the same response. This is the half that a confident-sounding tool leaves out, and it is the half that tells you how much weight the rest deserves:
- Volume data limited to visible bars only
- No higher timeframe context available
- Momentum indicators not visible
All three are consequences of the input being one picture. It read the volume pane because the screenshot included it; it had no daily chart to check the 4h read against, and no oscillator to confirm the weak momentum it described, because neither was in the frame. Crop more in and it sees more — that is the whole mechanism, and it is why it never pretends otherwise.
Do it with your own chart
- 01
Screenshot the chart — any platform
Grab the chart as an image. TradingView, MetaTrader, your broker's terminal, a phone screenshot of any of them. Nothing has to be installed and nothing is connected to your broker: the file is the whole input. This example is a TradingView BTCUSDT 4h window cropped to the chart pane, 2505 × 1800 pixels, about 300 KB.
- 02
Drop it on the analyser
PNG, JPG or WEBP up to 8 MB. The first analysis needs no account and no card — you are signing in only when you want the next one, and signing in and signing up are the same step.
Open the analyser
- 03
Wait about nine seconds
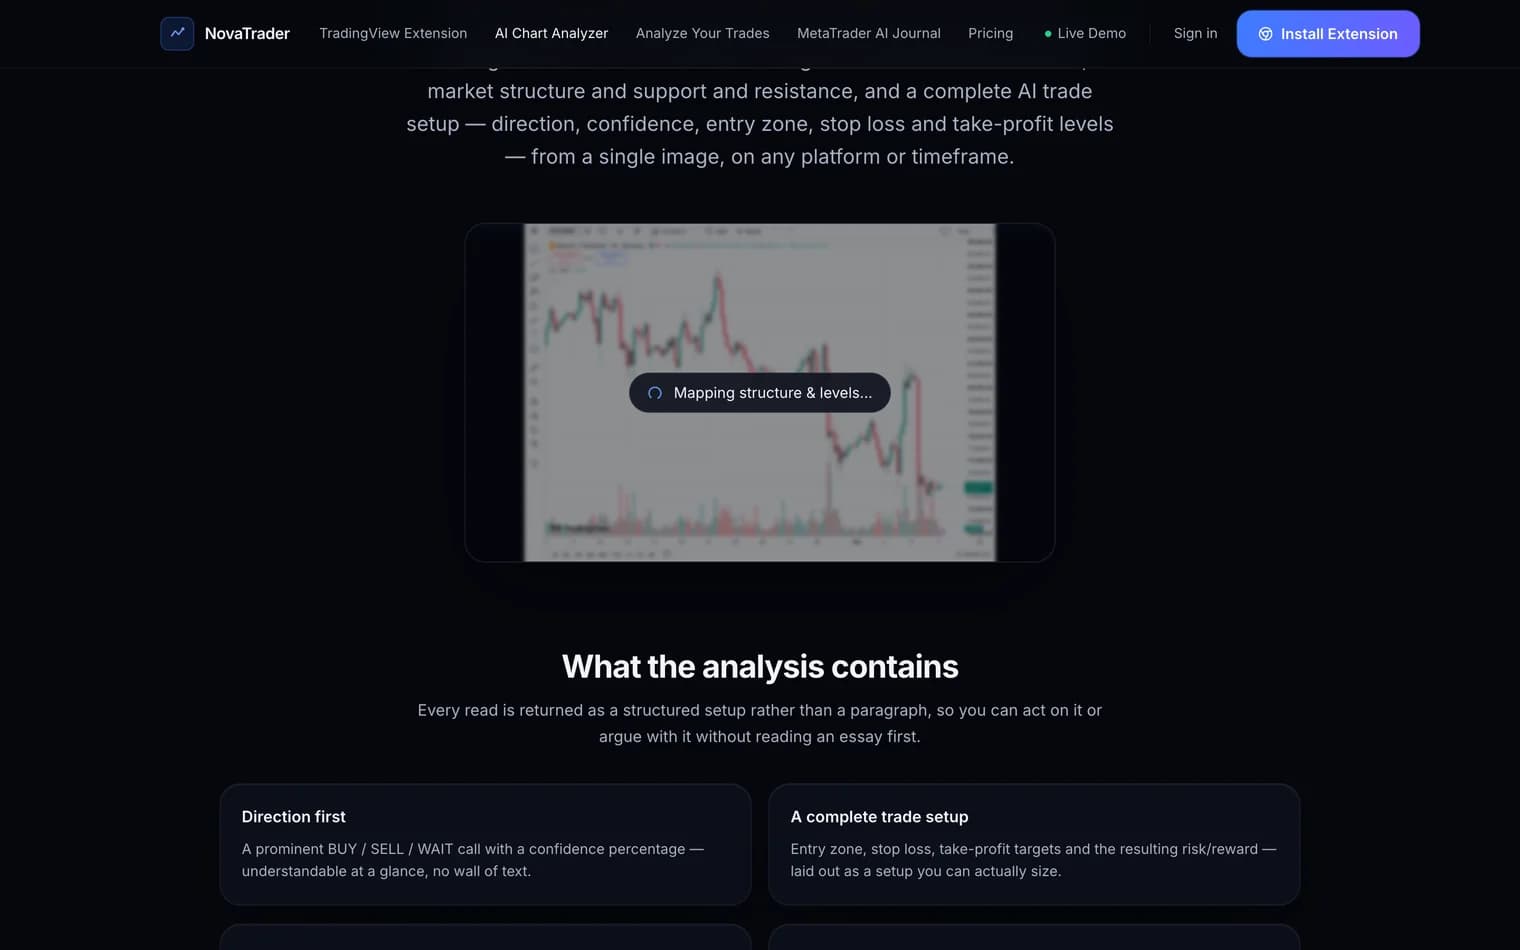
Your image goes up and the read comes back. The stages it shows you — reading the chart, mapping structure and levels, evaluating scenarios — are the order the answer is actually assembled in, not a loading animation with invented captions.
- 04
Read the call, then argue with it
The card gives you the direction, the confidence figure and the short reasons behind it. In this example that was WAIT at 60% — and the three reasons underneath are the part worth disagreeing with, because they are checkable against the chart you just uploaded.
What it reads, and what it does not
The image is the entire input. Anything drawn on it can be used; anything not on it is not quietly fetched from somewhere else.
- Trend, market structure and the shape of the move
- Support and resistance, with a strength for each
- Candle behaviour at the levels that matter
- Indicators you plotted — RSI, MACD, moving averages, Ichimoku, Bollinger Bands
- The volume pane, when it is in the frame
- Symbol and timeframe, when they are legible
- Pull live prices, an order book or positioning data
- See price history beyond the bars in your screenshot
- Consult an indicator you did not plot
- Read a higher timeframe you did not include
- Place, size or manage any trade
- Promise an outcome — the direction can be WAIT
Four ways to get a better read
- Leave the axes in. The price scale and the time axis are how levels get numbers. A chart cropped to the candles alone produces a read in shapes rather than in prices.
- Include what you want weighed. It only sees the frame. If the daily matters to your decision, send the daily too — the example on this page reported “no higher timeframe context available” precisely because it was one 4h window.
- Do not pre-draw your conclusion. Your own trendlines are read as part of the chart. That is useful when you want them checked, and misleading when you wanted an independent opinion.
- Read the confidence, not just the word. 60% on a WAIT is a different statement from 85% on a BUY. The number is how strongly the visible chart supports the call — it is not a predicted win rate.
Try it on the chart in front of you
One screenshot, about nine seconds. The first analysis needs no account and no card.
Frequently asked questions
- What does “pro trader level” actually mean here?
- Three things that separate an analyst's read from a signal feed. It states a confidence figure rather than an opinion. It will tell you there is no trade — the example on this page does exactly that. And it gives you the level that would prove it wrong, so the read can be tested instead of believed.
- Does it need to know the symbol or the timeframe?
- No, and it is not told them. In this example it read BTCUSDT and 4h off the image itself and reported full confidence in both. If the symbol or the timeframe is cropped out or unreadable, it says so rather than assuming one.
- Why did it refuse to give a trade?
- Because the chart did not contain one. Price was consolidating under resistance with no clear break in either direction, so an entry would have been invented rather than read. Instead of a setup it returned two conditional plans — one for a break up, one for a break down — each with its own entry, stop, targets and risk/reward.
- Is the analysis on this page a real one?
- Yes, and it is one request, not a best-of. The chart was uploaded to the free analyser on this site on 7 November 2026, the response took 8.96 seconds, and every number, level and sentence quoted here is reproduced from it — including the three limitations it declared about itself. The screenshots and the recording are that same response rendered by the live page.
- How accurate is it?
- It is a probabilistic read of one image, and it is presented that way: a confidence percentage, a bull/bear split, and an invalidation level that exists precisely because the read can be wrong. It has no order book, no positioning data, no news feed, and no price history beyond what your screenshot shows. Treat it as a fast second opinion, not a forecast.
- Which platforms' charts can it read?
- Any of them, because the input is an image rather than a data feed. TradingView, MetaTrader 4 and 5, cTrader, broker web terminals, exchange apps — stocks, forex, futures, indices and crypto all read the same way. Indicators you have plotted are read as drawn; indicators you have not plotted are not secretly consulted.
- What does it cost?
- The first analysis is free and needs no account. After that a free NovaTrader account includes 15 AI requests per 30 days, and paid plans add more — see the pricing page. One upload is one request no matter how much work happens behind it.
- Is my chart stored?
- The free no-account analysis is not saved and is not attached to any account — the result is returned and that is the end of it. When you are signed in the analysis is kept in your own history so you can go back to it. See the Privacy Policy for the full picture.
Want the same read without leaving your chart? The TradingView extension puts it in a panel on the chart page. Want to test an idea rather than read one? See building a strategy with AI.
The analysis quoted on this page is one real AI-generated read of one chart on one day, reproduced in full. It is information, not financial advice, and not a prediction. Every figure in it — including the levels and the risk/reward on the conditional plans — describes what the model read from a picture, and it can be wrong.